Model Explorer
Model Explorer is a tool that visualizes the model and the data as a Model diagram. It enables a dynamic way to view the model from multiple perspectives.
Model explorer facilitates analyzing dependencies, exploring connections, showcasing the model to others and makes complex structures easier to understand and communicate.
Overview
Navigating the Canvas
The Model diagram consists of an "infinite" canvas where the model entities are shown as nodes.
You can use your mouse or trackpad to zoom in and out on the canvas.
In the bottom right corner of the canvas there's buttons to zoom in and out, and a button that automatically adjust the canvas' zoom to fit all visible nodes.
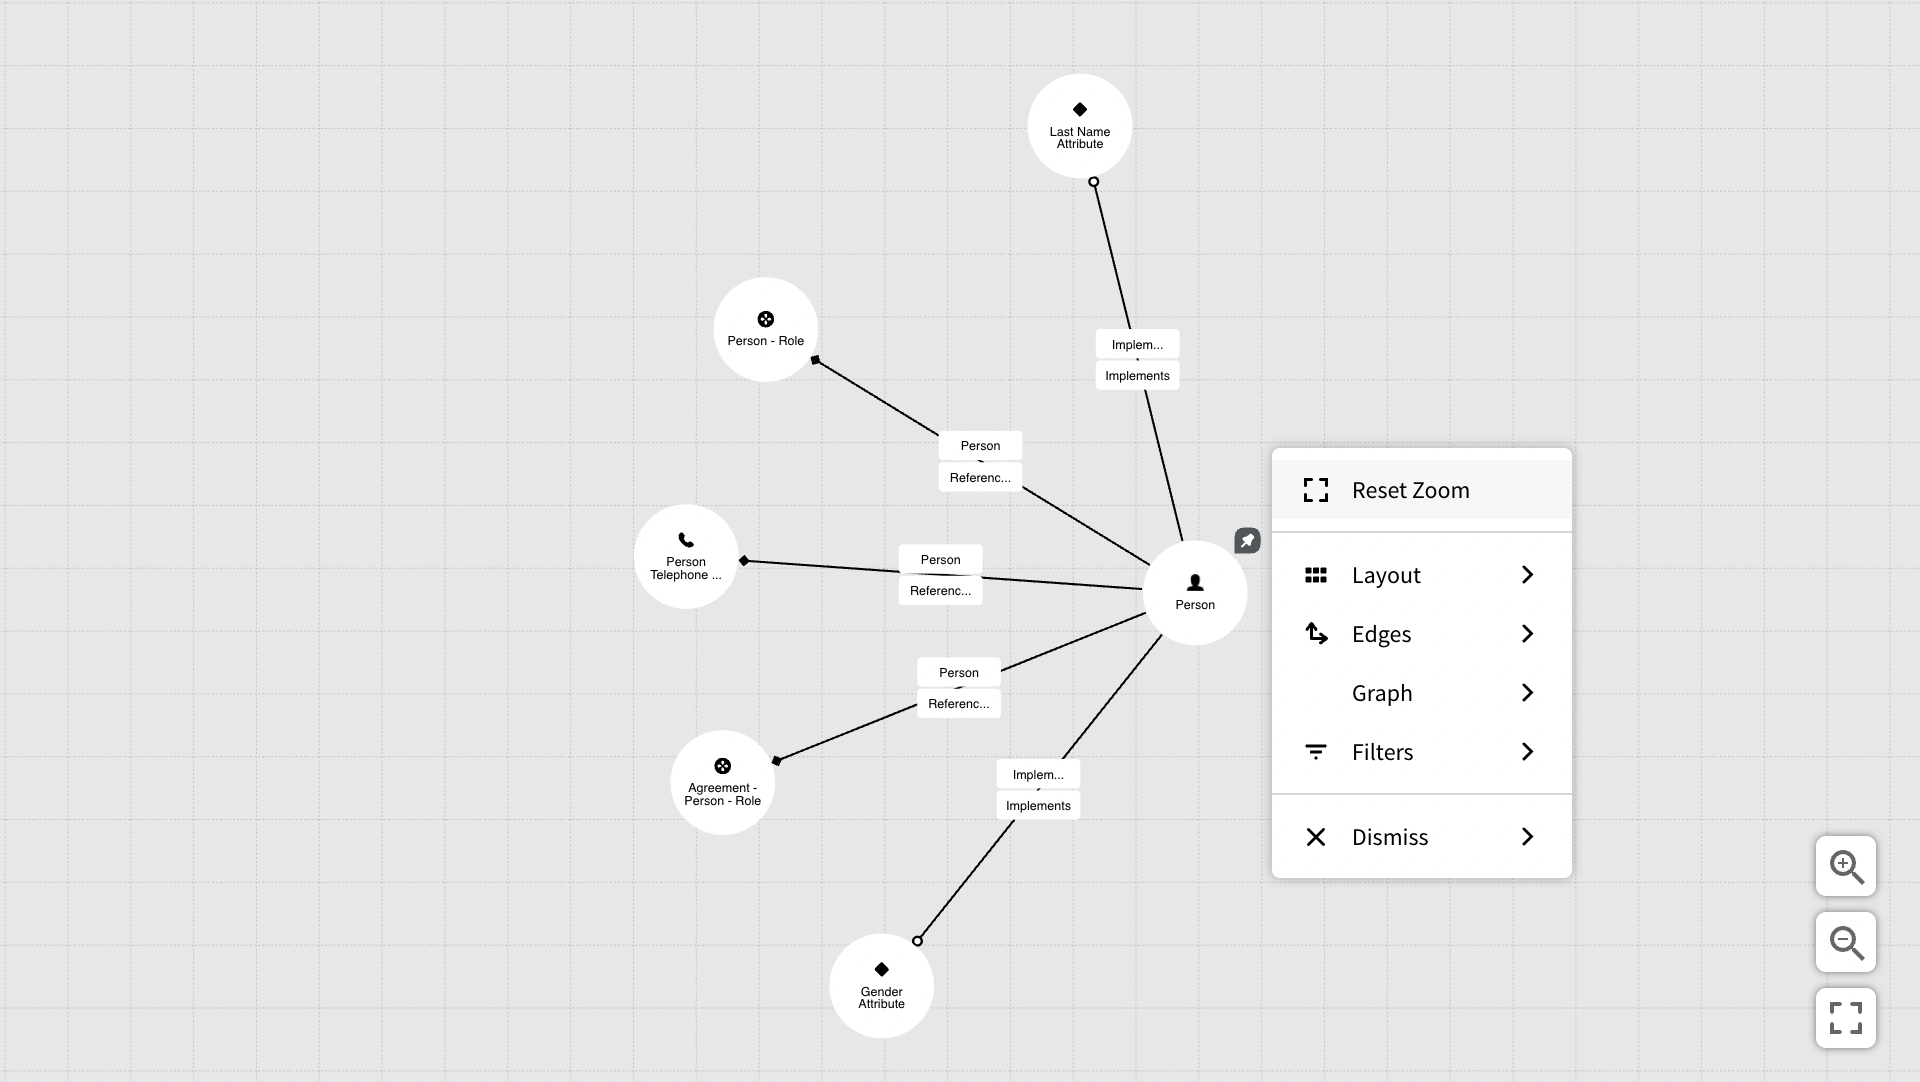
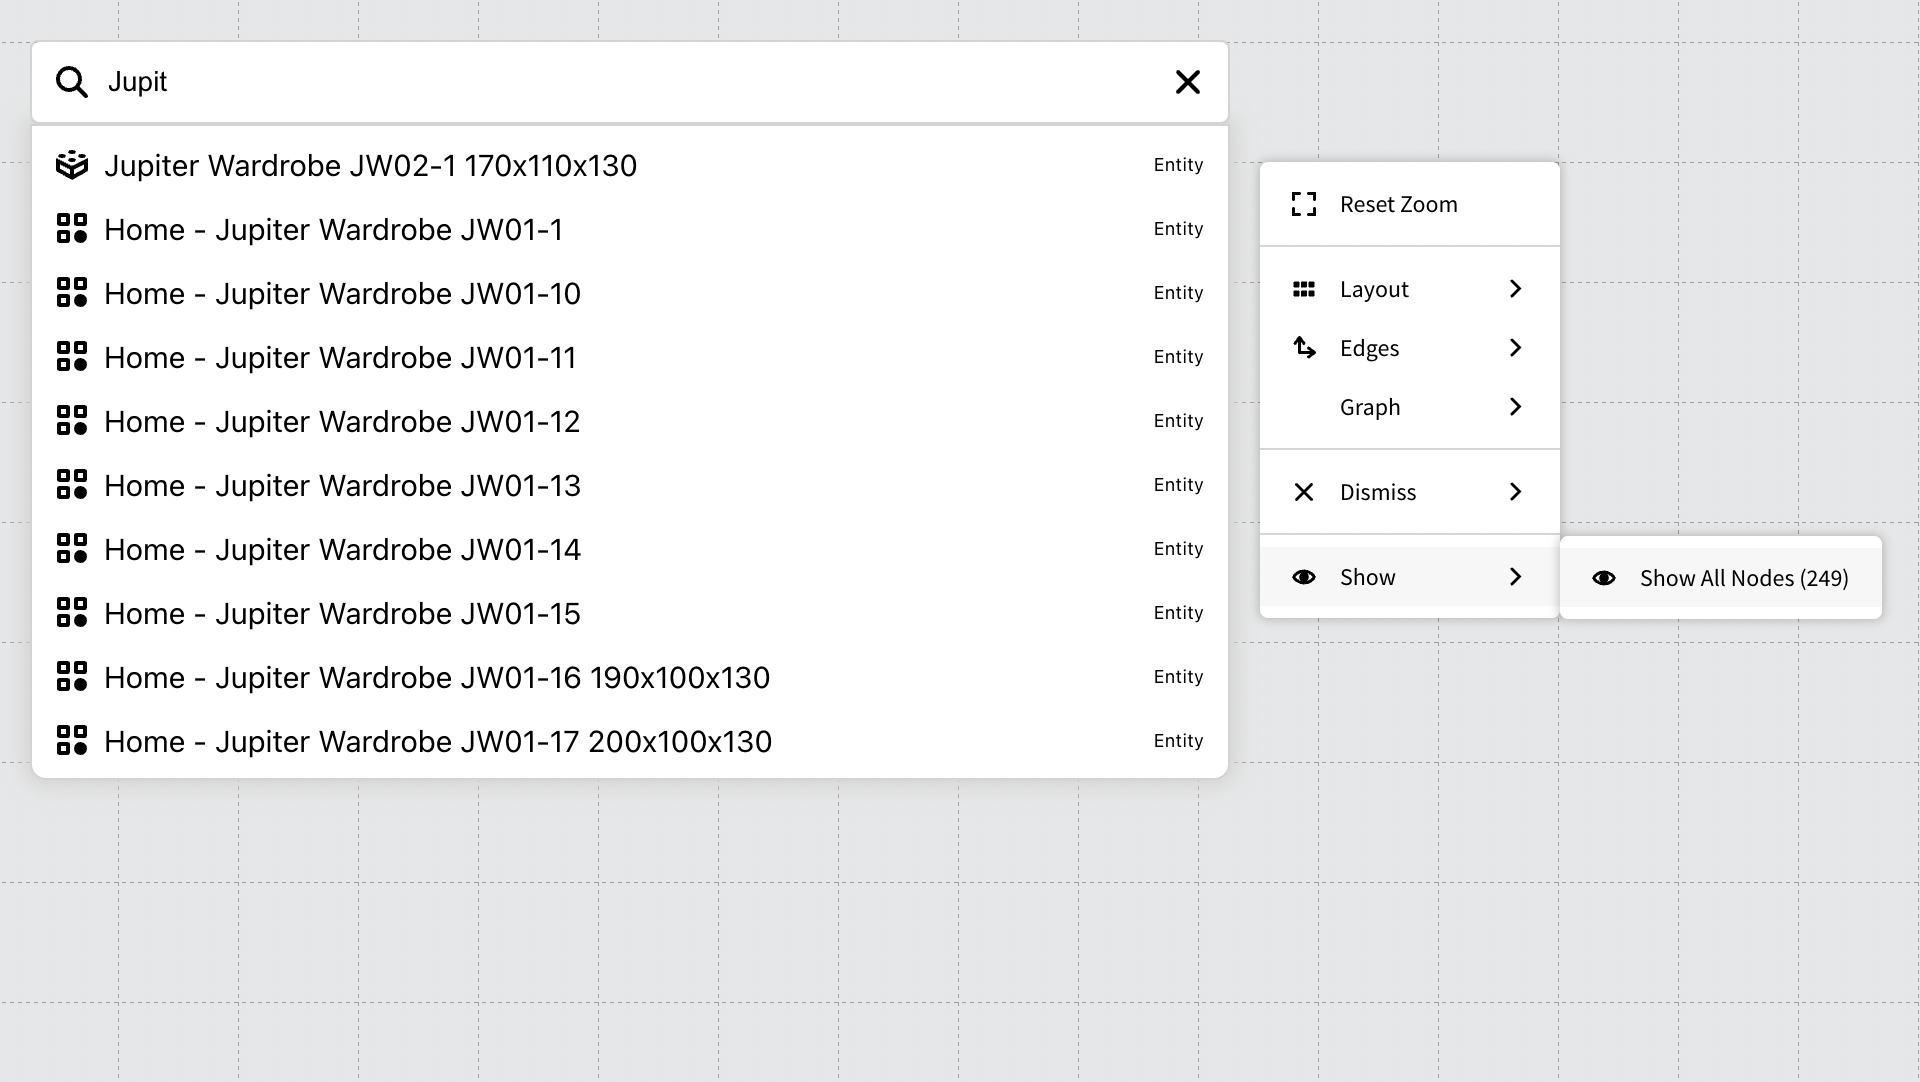
You can also reset the zoom level by right-clicking the canvas background and select Reset Zoom from the menu.
Moving and pinning nodes
The Model Diagram is a force graph, meaning that it will automatically try to position the nodes according to an algortithm in order to optimize layout and avoid overlapping nodes. You can however drag and drop nodes and place them elsewhere if you want. Note that adding and removing nodes will affect the layout and positioning of the nodes.
You can however lock a node's position on the canvas by Shift clicking the node. Moving the node will un-pin the node.
Creating a Model Diagram
Model Explorer supports two perspectives or "modes". The Model mode is where you create the Model diagram from the model's definitions – and the Data mode then allows you to explore the instances or "data" associated with that model diagram.
To create a Model diagram you must first select the nodes you want to include from the model. Model diagrams are typically based on Definitions (Definition Nodes/Association Definitions) bur the legacy data types, Generic Type and Generic Unit are also supported.
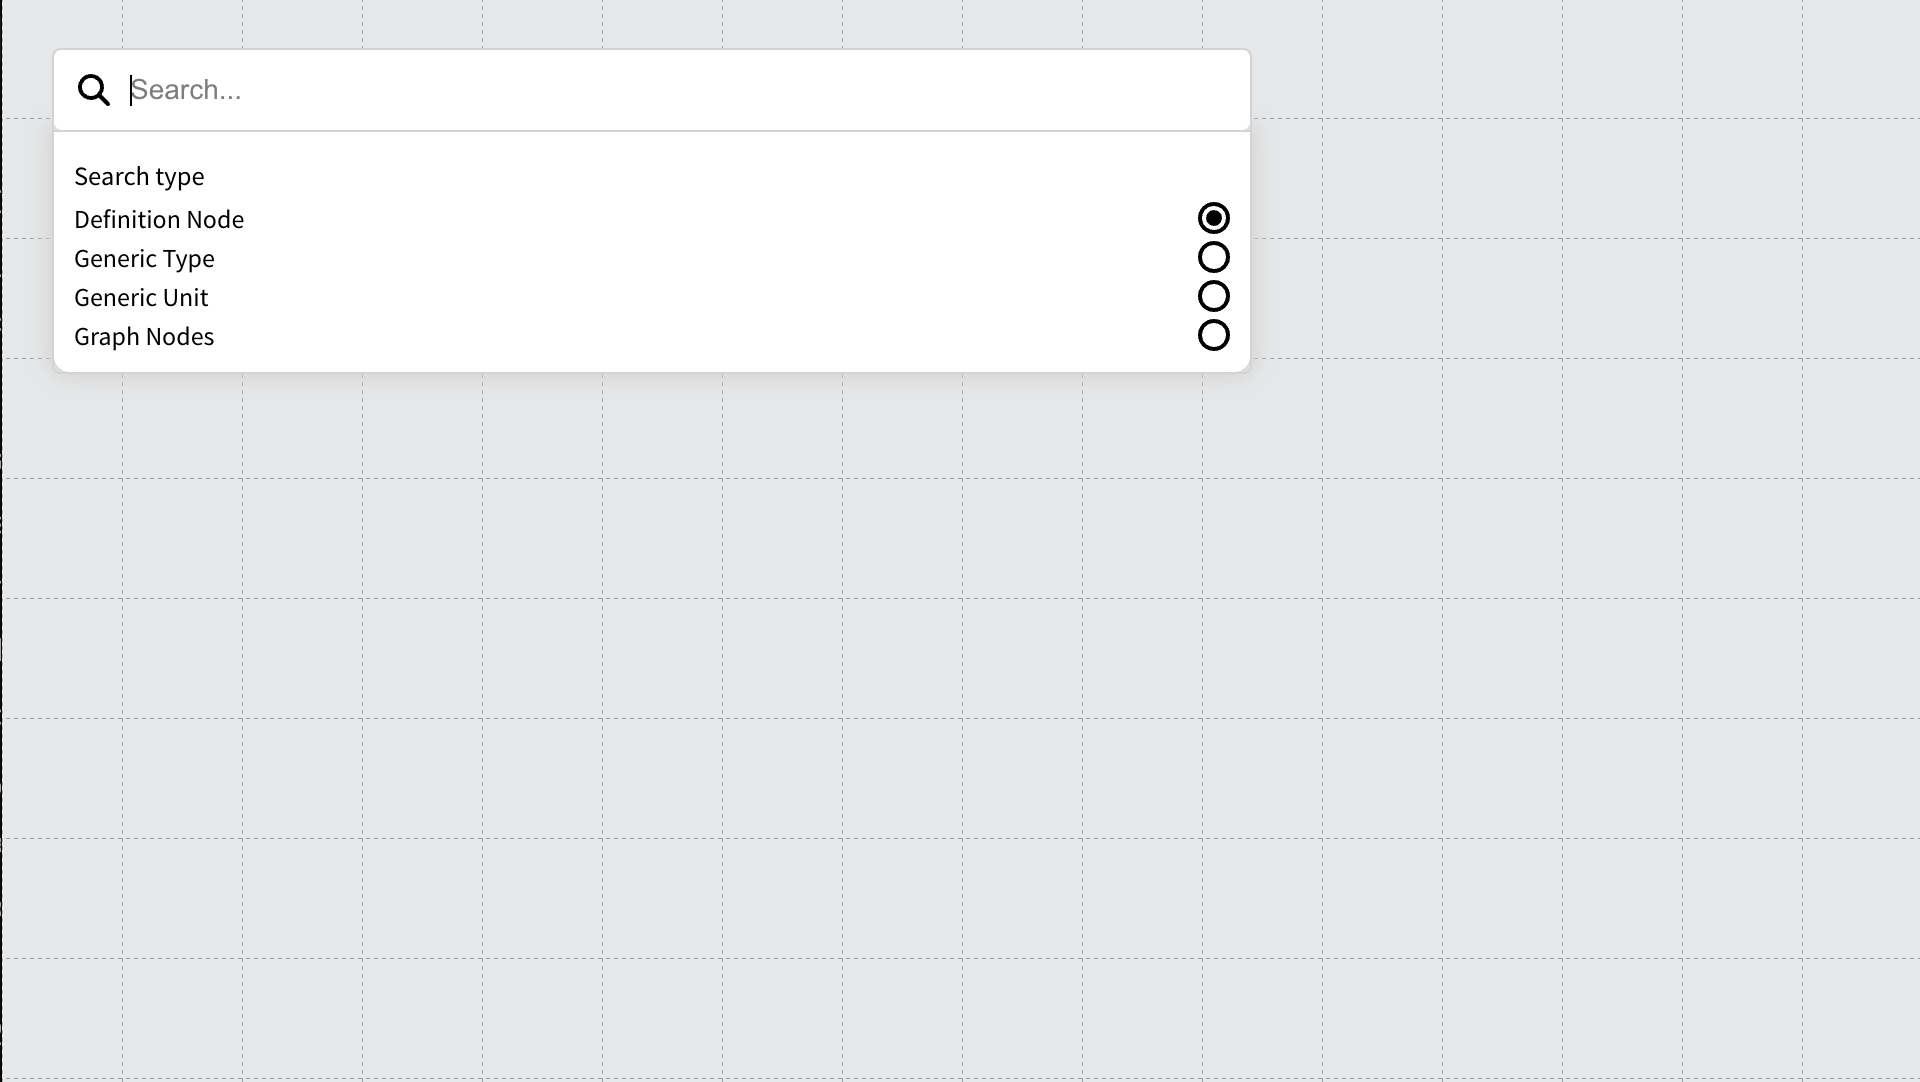
To add a node, use the search located in the top left corner of the canvas. Definition Node is selected by default, but you can change the basic data type from the search dropdown menu.
Find in Canvas
The search also lets you find and navigate to nodes that are already added to the Diagram. To do so, select Graph nodes from the search drop down menu.
Inspecting the Nodes
Once a node has been added to the canvas, you can inspect its connections and properties. Right-click on the node you want to explore and select inspect to choose between three options in the sub-menu:
- Entity panel: Opens a dialog for the node where you can see all the relationships, attributes, references, etc. that the definition has. Select entities from the list to expand to the Model Diagram and add them to the canvas.
- Node scheme: Here you can see a database schema for the entities linked to the node you are viewing.
- Attributes panel: Allows you to see the node's attributes and gives you the option to export the data to Excel.
At the bottom right, you can see the number of nodes in your model.
Customizing the diagram
You can customize how the diagram appears by right-clicking the canvas (anywhere that is not a node) From this menu, you can customize the following:
Layout
-
Hierarchical
- Vertical - Ordered
- Horizontal – Ordered
- Vertical – Force
- Horizontal – Force
-
Matrix (creates a matrix structure within the canvas)
-
Grid (structures the model like an XY grid or):
- Only a Y-axis grid
- Only an X-axis grid
-
Adjacent matrix (Creates a matrix for all the references and how they relate to each entity in the model explorer.)
-
Radial (Creates a half-circle around the main definition nodes)
Edges
To determine how the edges should look, i.e., whether they should be curved, straight, and how they should show the connections between the nodes. Right click the canvas and choose one of the alternative edge types that are available.
Hide Multiplicity
This option toggles showing multiplicity on/off for any attribute on the canvas.
Custom Relations
It is possible to create a custom relation between two nodes – An edge bypassing one or more steps (nodes) in the canvas, that might be irrelevant for the diagram and current context.
If you want to create a custom relation, select the node you want to start from, "The root" – right click it and choose Create edge. Then from the dialog, give the new custom relation a name.
Expand Add Step to see all Attributes, Relations and References that the node has and select the node you want to create a custom relation to.
Once a selection has been made, you can continue adding more steps. Expand the one you just added to see its connections and click to add another step. Continue to do so until you have found the connection you want to create the custom relation to, and then press the Create button. You can remove a step by pressing the minus button next to the node.
The Custom Relation will show an edge directly between the root node and the node of the final connection you made, bypassing any step in between.
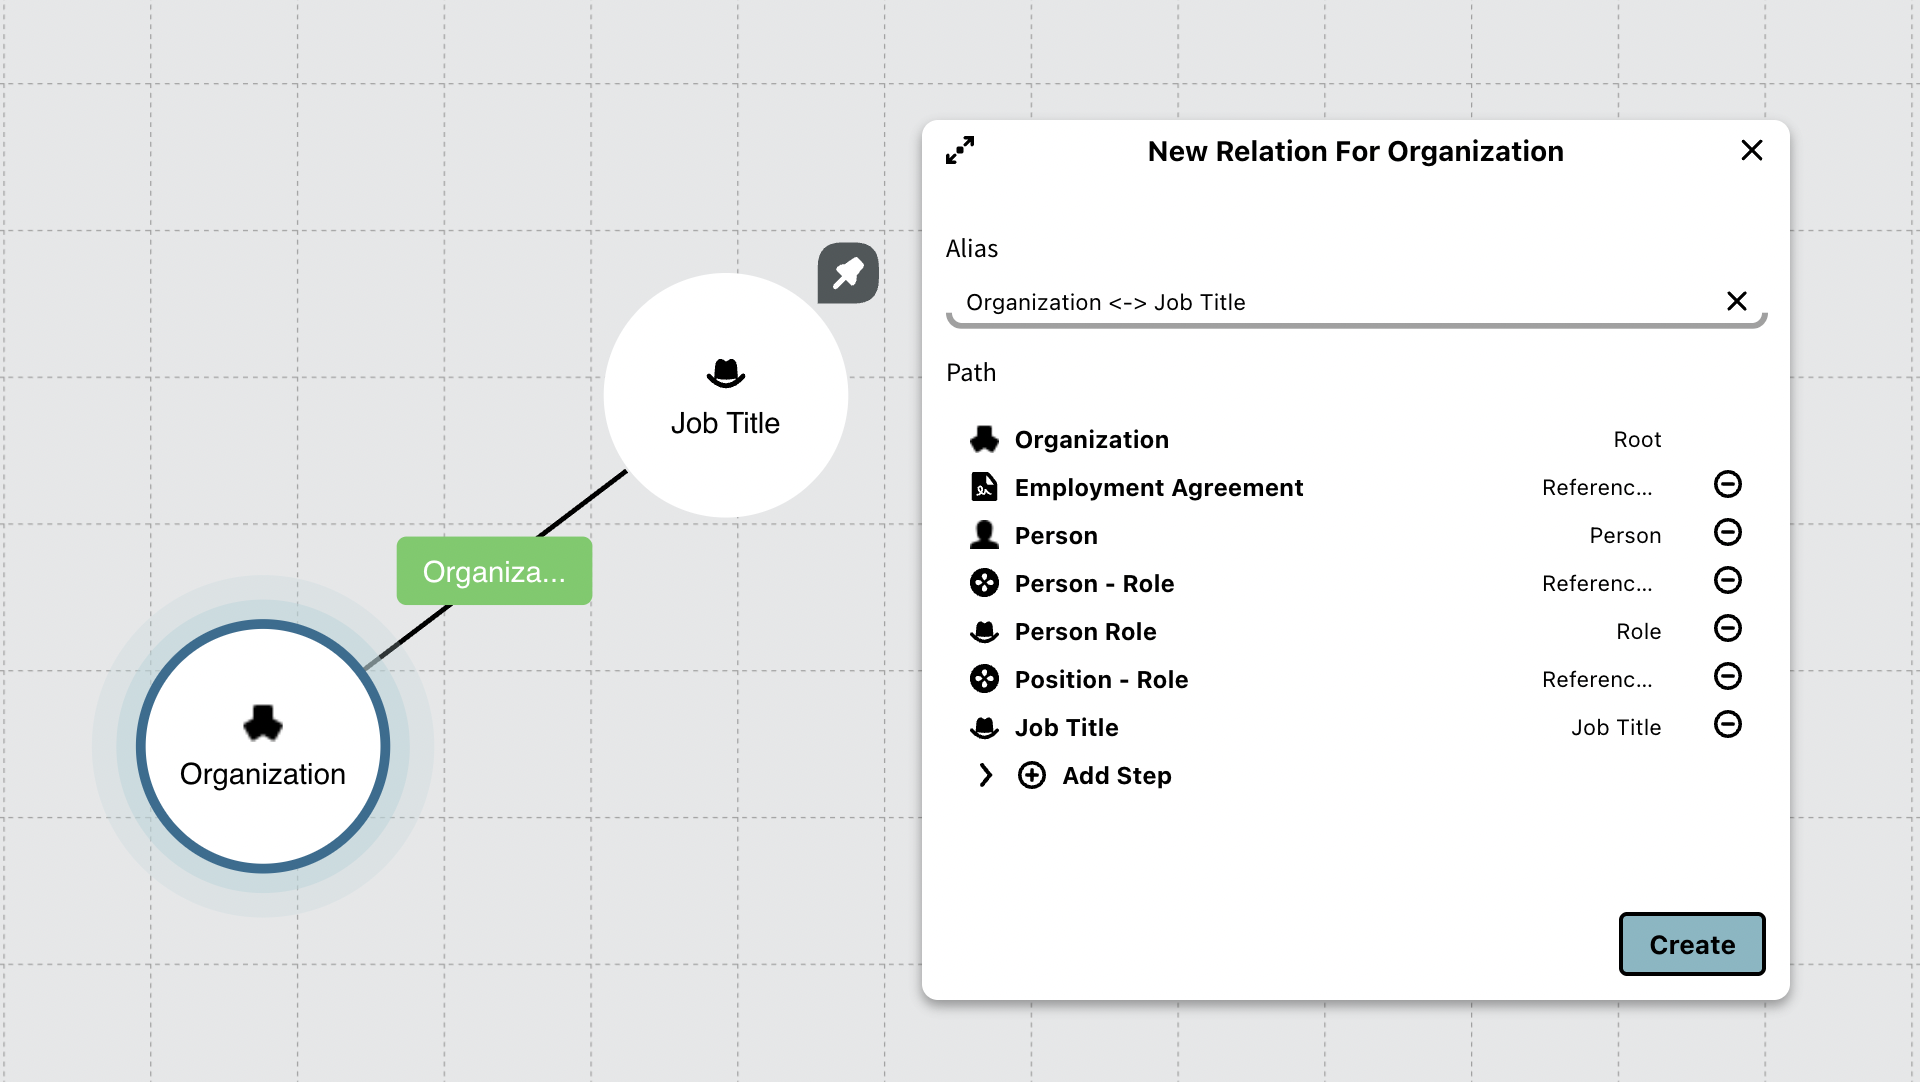
A custom relation between Organization and Job Title and the "invisible" steps between the two nodes.
Canvas modifications: Under "Graph," you can determine how the model explorer's canvas should function, i.e., whether it should have a grid system or not, whether there should be a "Center force," or if you want to invert the shapes of the nodes, making the nodes rectangular instead of round.
Filtering: If you want the model to show specific connections, you can do this by clicking on "filters." Here you can select the connections (i.e., relations, attributes, references, etc.) that you want to be displayed in the model or not.
Changing node colors: You can change the color of the different nodes in the model by right-clicking and then selecting the color you want the nodes to have.
Node Queries: If you want to see or change an entity's query, this is possible by right-clicking on the entity you want to change and selecting "edit query."
Removing nodes: To remove nodes, you can remove individual nodes by right-clicking on the node you want to remove and then clicking the "dismiss" button.
Remove multiple nodes at once, you can Ctrl + Left-click on the nodes you want to remove and then right-click in the graph and select the "dismiss selection" button.
You can also remove all except the selected nodes using the "dismiss all except selection" button.
Inspect Panel
The inspect panel can be found un the lower left corner of the canvas. It is automatically expanded when you hover the mouse cursor over it. The inspect panel has two tabs, the first tab shows details about the currently selected node and the second shows details of all nodes in the model diagram.
The inspect panel allows you export to JSON or Excel.
Data view
The data view is a mode that lets you explore all the data – the instance nodes of a model diagram.
To do so you must first create a diagram with all the definitions for the instance nodes that you want to include.
Once you hace your diagram ready, click the data view ▶ button located in toolbar (top right) to switch mode.
Click the model view icon to toggle back.
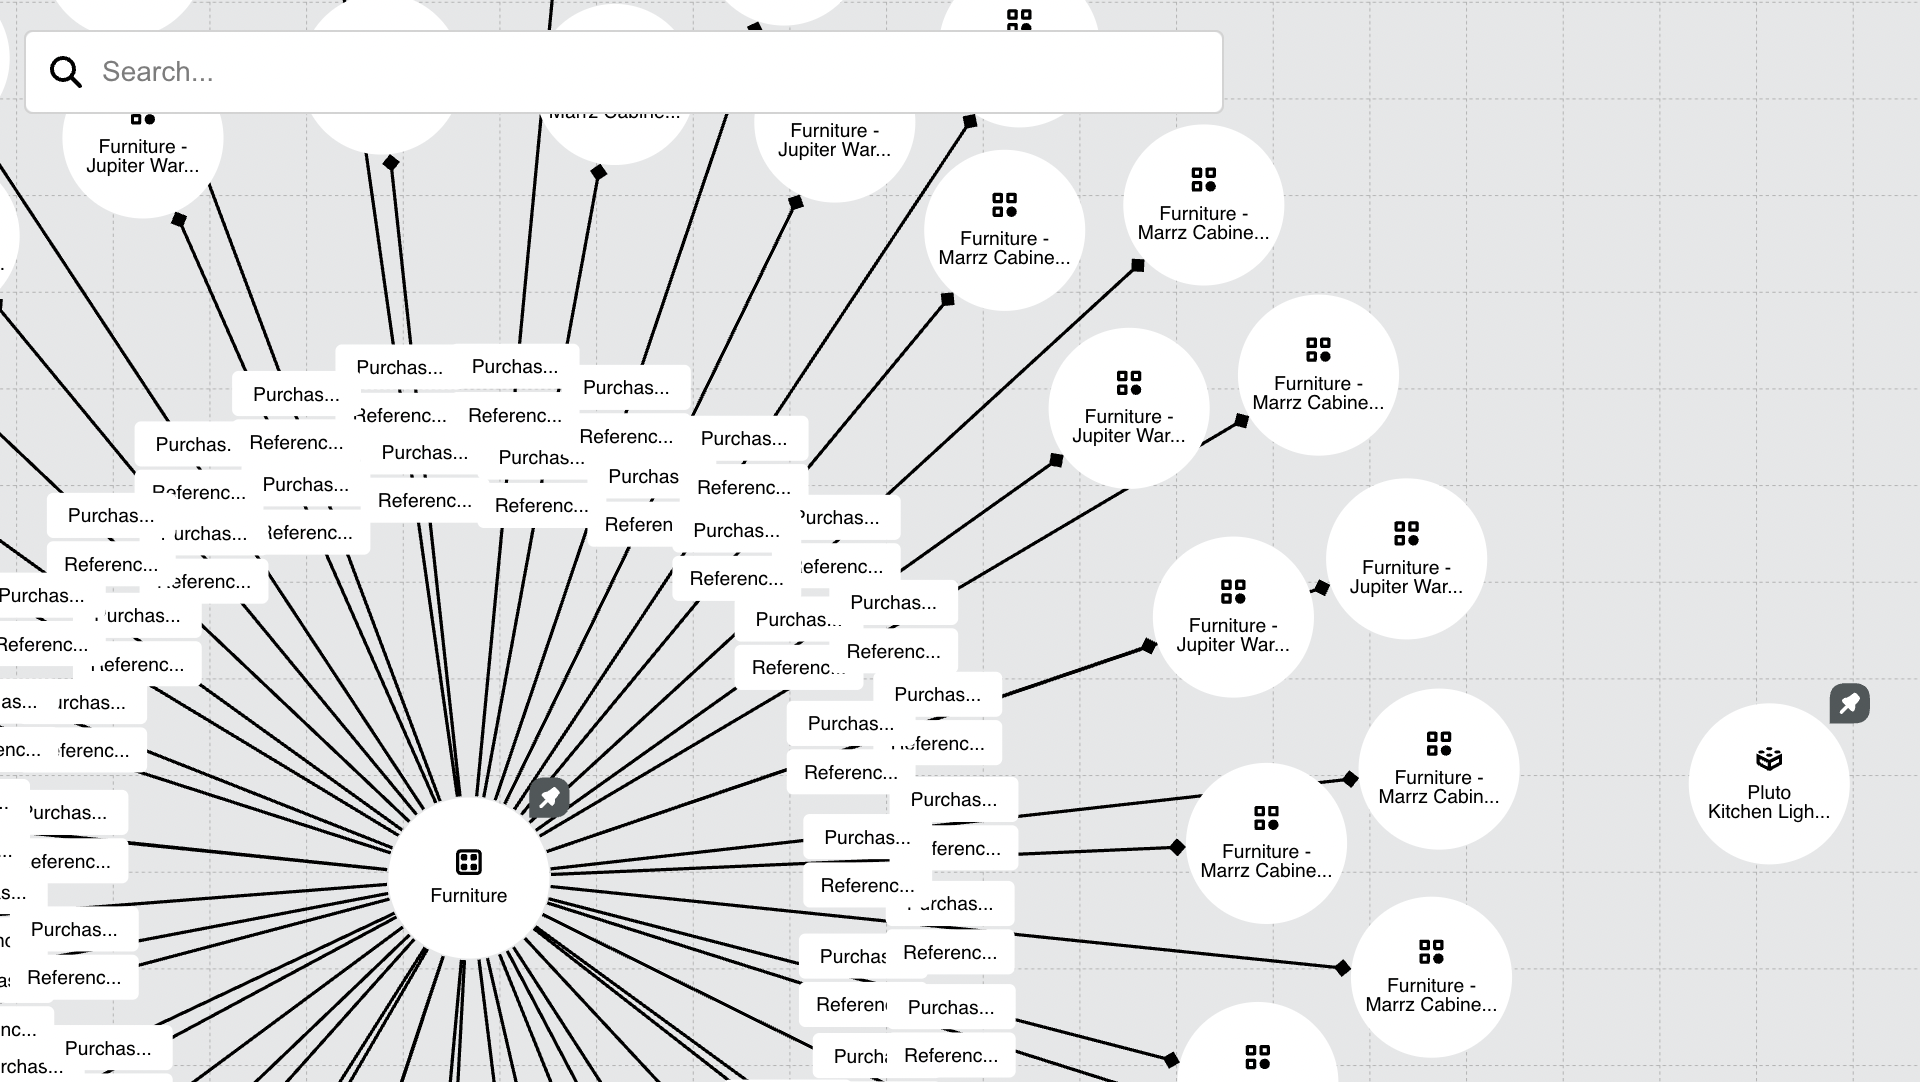
The Data View will open a blank canvas but use the Search to populate the data view according to your needs.
You can also right-click the canvas and then select show/show all data nodes." inorigo® will reveal how many instance nodes that will be added in parenthesis.
Note: The amount of instance nodes you chose to display will greatly affect the performance of the graph. Be careful with larger models as the amount of data can make the loading process extremely slow.
Functions:
In the data view, you can use the same structural options as in the model view. However, when you click on a node, you can only implode or explode the node, as well as remove it (dismiss).
Implode the node if you want to gather all connections to the node in one node.
Or explode it, when possible, to show the nodes connected to the explodable node.
Note: The Data view is non-persistent. Switching back to the Model View mode will clear the canvas.
Keyboard Hotkeys:
- Pin Node: Shift + Left click: Allows you to pin the Node to the canvas to make it immovable.
- Select multiple nodes: Ctrl + Left click.
© 2025 Inorigo AB. All rights reserved.